商品介紹
本產品出貨為最新版本。
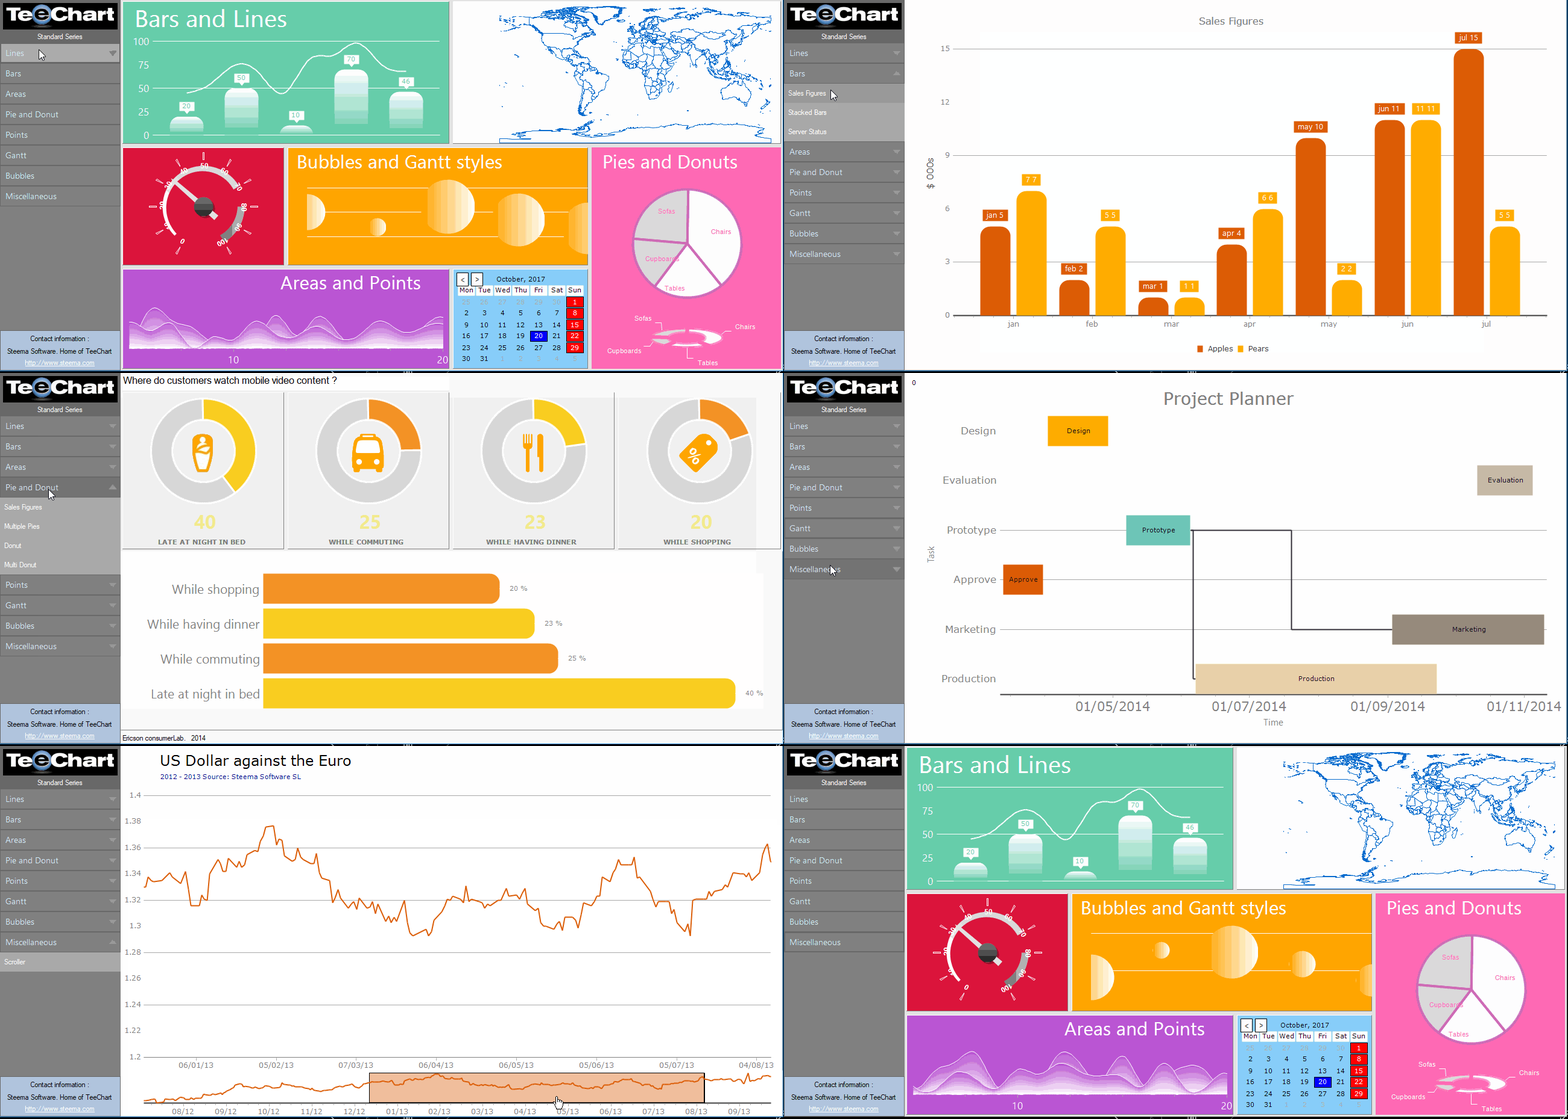
The TeeChart Pro ActiveX charting component library offers hundreds of graph styles in 2D and 3D, 57 mathematical and statistical functions for you to choose from together with an unlimited number of axes and 14 toolbox components. The charting control can be efficiently used to create multi task dashboards.
Plug-in versatility
The ActiveX chart control plugs into most COM compatible environments as a web chart in serverside libraries, a scripted ASP chart or desktop application.
Easy to Use
You'll see how easy it is to code TeeChart and how you can improve department development productivity.
More than just a Chart
Includes chart, map & gauge controls plus over dozen toolbox components.
Steema’s commitment
We have been developing TeeChart since 1995, and endeavour to continue offering you the best tools for the job in the future.
Chart collection
Complete gallery of 2D & 3D chart types and toolkit
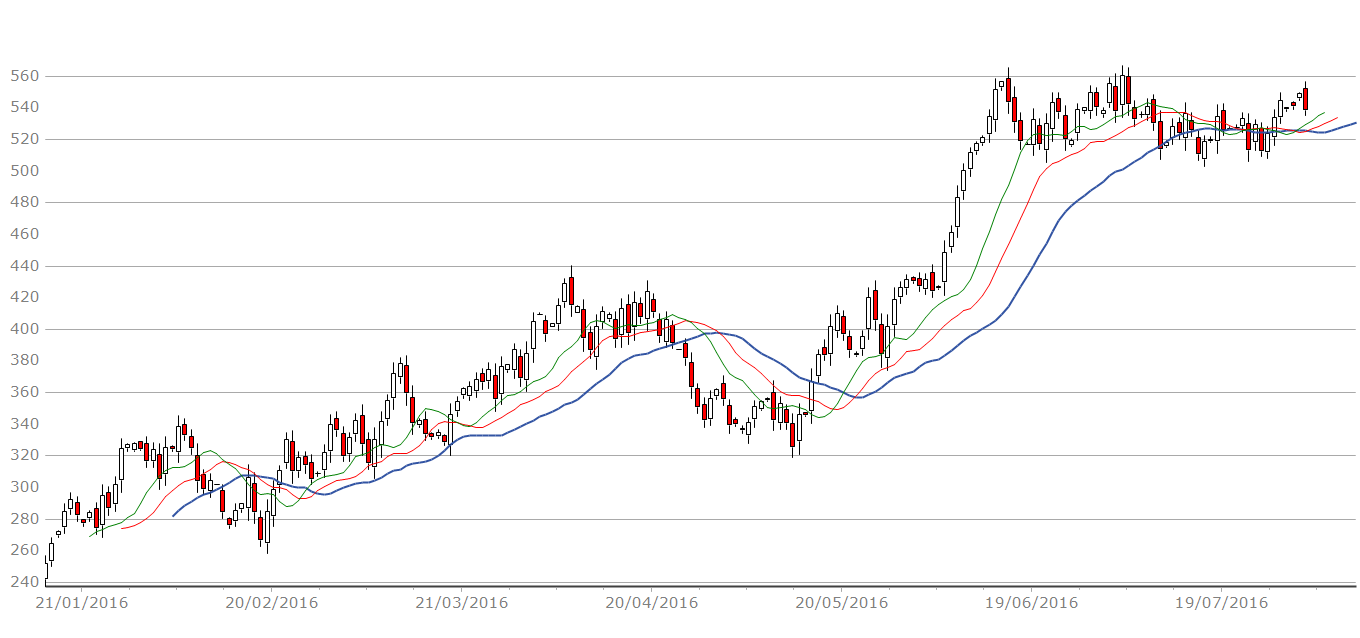
The ActiveX charting control offers a complete and customisable collection of over 70 types of charts for data visualization. From the common Line, Bar, Area, Pie chart to the field-specific charts like Candle OHLC, Point and Figure, Volume, High-Low, BoxPlot, etc.
Coded examples are available in Steema/TeeChart-ActiveX repository on GitHub.

Fully customisable Gauges
Combine analog and digital displays for interactive Dashboards
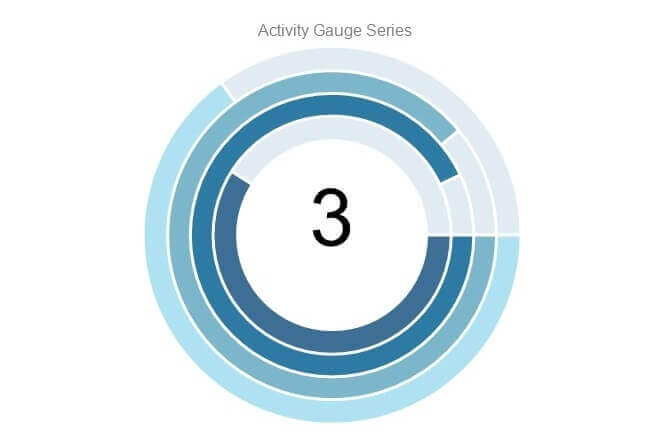
The ActiveX gauge offering includes Circular Gauge (Radial Gauge), Linear Gauge (Horizontal or Vertical), Numeric Gauge (Digital Gauge) plus combinations and various customisation options.

Financial and Statistical indicators
Business, Financial and Scientific data
The ActiveX chart component provides a large selection financial and statistical indicators that perform calculations ranging from basic mean; Mode function, Median function to the more complex statistical and financial functions. A specific list of current functions and indicators may be viewed at the
features section below.
